Support: Frequently Asked Questions (FAQ)
Have a question? Your answer might be right here! Click on a question in the list at the
top of this page to jump to the answer.
To do a keyword search on this page, pressing Ctrl-F or Command-F on the keyboard will bring up a search box
in most web browsers.
You can also find a lot of helpful information, especially if you are just getting started
with MEI, in the Training
Videos.
If you still have questions, or if you have suggestions for updates or additions to the FAQ,
contact Customer Support using this
form or by email. Add pfsupport@optimiserenergy.com to your contacts to help make sure our newsletters and responses to your support requests don’t get stuck in your spam filter. It is generally best to contact support in writing, but you can also call and leave a voicemail at 413-545-8525.
Still haven't found the answers you need? Contact Customer Support using this form or by email.
Getting started (setting up users, logging in)
What browser should I use?
MassEnergyInsight fully supports Chrome, Safari, and Edge browsers. Firefox used to have issues with some drop-down boxes that were used to make selections from lists, but we believe those have been resolved. Internet Explorer is not supported and has several points of failure in the application.
How do I add a new user or change a user's access level?
MA DOER requests that each user have their own MassEnergyInsight username and password to
access the system. Authorization letters must be on file with MA DOER for each user.
Letters should use this template - Word - and be signed by the chief elected or appointed official for a
municipality, or by the superintendent to create/update an account associated with a
regional school district.
Submit your authorization letter to your DOER
Green Communities Regional Coordinator.
If you need to change a user's access level, submit an updated authorization letter to your
RC, and the existing user account will be updated accordingly.
State employees can get access to MEI for their agency by contacting DOER's
Leading by Example Division.
Who is my Green Communities Regional Coordinator?
The Regional Coordinators are:
- Dillan Patel - Northeast
- Lisa Sullivan - Southeast
- Kelly Brown - Central
- Zach Jenkins - Western
See the regions and contact info for RCs here on the DOER website
When should I contact my Regional Coordinator and when should I
contact support?
In general, you should contact your Regional Coordinator about programmatic questions
(how to set something up in to meet the guidelines of the program), and you should
contact support for technical questions about how to use the application. If you're not
sure, go with your best guess, and each of our teams (RCs and MEI support) will pass the
question along to the appropriate team.
Can I share my username and password with someone else?
To protect your data, and give you the greatest control over who has access to it, we
recommend that you use a separate login for each user and that you do not share your
username and password with others. Having separate accounts for each user allows us to
deactivate an account when someone leaves without impacting other users. It also makes
it easier to determine which user made a given change to your data, in case there are
ever questions about why things were set up the way they were.
How do I set up my account?
Follow the instructions in the your initial email from support to go to the website and
set up your password.
How do I log in?
- Go to https://www.massenergyinsight.net
- Enter your username, exactly as given to you, and the password you created. If you
have access to more than one town, please make sure to use the correct "+townname"
version of you email address to log in to the account.
- Sometimes your browser or a password management tool will auto fill this information
for you. Make sure that it is filling in the correct user account for the town you
want to log into, and the correct password for that account.
What can I do on the Home Page?
- When you first log in you will be the Home page. The
Home page is the launching point for all MEI actions. On this page
you can click on the three major activities: View your
dashboards/reports, Organize your data, or
Update your data by spreadsheet.
- At the top of the Home page and every page in MEI in the upper
right hand corner of the screen, you will see your username and 5 actions that you
can take: Home, Support, Change
Password, Sitemap, and Log out.
- Click on Home to return to the Home page from wherever you
are.
- Click on Support to watch short training Videos
about MEI, read these FAQs, read a
Glossary of frequently used terms, or Contact
Support if you have a question for customer
support.
- Click on Change Password to change your password.
- Click on Sitemap to see an outline of the website with
clickable links that direct you to specific locations in the website.
- In the main section of the page you will see 3 actions that you can take:
view reports, organize data, and upload a
spreadsheet. These options are available in the menu bar on every page
at the top left below the logo,
- Click on view reports to view MEI's reports.
- Click on organize data to view the Organize Data
Tree.
- Click on upload a spreadsheet to add utility data by uploading
a spreadsheet.
- In addition, on the Home page we have three sections where you can
see recent announcements regarding MEI in What's New (if there are
any current notifications), check on the status of investor-owned utility data
updates in Utility Data Updates, or click on Getting
Started and watch a short video.
Is there a newsletter for tips and updates?
Yes! New users are automatically added to the newsletter list using the registration
email. If you need to subscribe using a different address, use this
signup form.
MEI users may also want to subscribe to DOER's Green Communities newsletter using
this form
See recent MEI newsletters:
Organizing your data in the Tree View
How do I set up my city, town, or agency?
- Click on Organize Data. How things are set up here determines how
information will be grouped in the reports located in the View
Reports section.
- When you click on Organize Data, you'll see what looks like a file and folder
hierarchy of the items in your city or town. We call this the "Tree View". The Tree
View consists of five levels. The highest-level is your municipality or agency.
Lower levels include department, complex, facility, and unit. Accounts can be
assigned at any of these levels, just know that a large number of reports are
designed to give you information at the facility level.
- In the Tree View click on the + sign to the left of any item to see
what's inside that item.
- In the Tree View you can move, add, delete and
reorganize items and account information.
Video
- Organize Your Energy Data
How do I edit the information for an item?
When you click on any item, you get taken to a series of tabs that information for that
item, and show you what other items are below that one in the tree, as well as what
accounts are assigned to that item.
Video -
Add a New Item to Your Tree
How do I save my changes or my data? I don't see a Save button on
the page.
The only time you need to click Save is when you see
a Save button on the page. For pages without that button, you
can assume that your changes are being saved as you move out of the field. Just hit
enter, tab, or click somewhere else on the page to save your changes.
How do I change the name of a Tree item?
- Click on organize data to see the Tree.
- Go to the item that you would like to change.
- Click on the name.
- Click on the text of the name and type in the new name.
- Hit enter, tab, or click outside the field to save.
Video
- Change the Name of a Tree Item
How do I delete items in the Tree?
- Click on organize data to see the Tree.
- Click show accounts within the Tree.
- Click on the item name.
- Click "delete this item" at bottom of page.
- Click OK.
- Click on organize data to see the Tree and confirm that the change has been made
correctly.
Note that any items below the one you are deleting, and any accounts assigned to an item
that's deleted, are not themselves deleted, but moved up one level in the tree. See more
about this below.
Video -
Delete Items from the Tree
If I delete a department, complex, building, or unit, what happens
to it?
When an item such as a building or a department is deleted from the Tree, all Tree items
below, or nested within, are preserved and assigned to the next item up in the Tree.
Additionally, the accounts associated with the deleted item and any items below it are
also preserved and assigned to the next item up in the Tree.
For example:
- You have a school department and 2 accounts associated with that department. Within
that school department is an elementary school, and 3 accounts associated with that
elementary school.
- You delete the school department.
- The elementary school is preserved, and it now sits directly under the town level,
as that is the next level up in the Tree.
- The 2 accounts previously associated with the school department are also preserved,
and they are now associated with the town, as that is the next level up in the Tree.
- If the elementary school was deleted accidentally, you can create it again. Know
thought that any data for the school, such as historical floor areas, interventions,
etc. would have been deleted with the school:
- Click Create New at the School Department level.
- Create the Elementary School again.
- In the Tree View, drag and drop the 3 accounts onto the Elementary School to
reassign them to the school.
How should I track building replacements or additions (aka building stock changes) in MEI? What if my community adds a new building?
Do not delete any removed accounts or buildings from MEI.
If a building is replaced:
- Go to the original building in MEI organize data, and mark any closed utility
accounts as inactive. In the area history for the original building, enter the date
when the building was demolished under “effective until” for the existing record (do
not change the square footage in that record), and add a new record with the square
footage of zero “effective from” the demolition date.
- Create the new facility in MEI. In the area history of the new building, enter the
square footage of the old building with a blank start date and an end date matching
the date when the new building came online, and enter the square footage of the new
building with the start date of when it came online and a blank end date.
If two or more buildings are replaced with a new, consolidated building (for example,
separate police and fire buildings are replaced by one new public safety facility):
- Go to the original buildings in MEI organize data, and mark any closed utility
accounts as inactive. In the area history for the original buildings, enter the date
when each building was demolished under “effective until” for the existing records
(do not change the square footage in those records), and add new records with the
square footage of zero “effective from” the demolition date.
- Create the new facility in MEI. In the area history of the new building, enter the
combined square footage of all buildings being replaced with a blank "effective
from" and an "effective until" date matching the date when the new building came
online, and enter the square footage of the new building with the "effective from"
date of when it came online and a blank "effective until" date.
If a building has an addition:
- In the area history, change the "effective until" date of the entry for the old
square footage to match the date the addition came online, add a new square footage
record with "effective from" date matching the date the addition came online and a
blank "effective until" date.
- If the addition involved creation of any new utility accounts, add those to the
facility in MEI.
If a new building is added to the municipal building portfolio without replacing an old one:
- If your community adds a new building after the Green Communities baseline has been established—and it is not replacing an existing building—you are not required to track or report its energy data in MEI under the standard Green Communities program. However, DOER strongly recommends that you do.
- Climate Leader Communities must track emissions data for all buildings, including new ones, in MEI.
- When adding a new building that is not replacing another building in MEI, it should be marked excluded from baseline, so the data does not impact your Green Communities reporting. (See the FAQ for instructions on how to exclude a building from the Baseline.)
- Communities are not required to track construction energy—that is, energy used before a building is occupied.
- If you're unsure how a new building affects your baseline and Energy Reduction Plan, please contact your Regional Coordinator for guidance.
What should I do if I'm just starting, or if I just took over MEI
for my city or town?
- Create your departments and buildings. Review any items (buildings, vehicles, or
streetlights) that are already assigned to departments or complexes and confirm
their assignments.
- Reassign any items as necessary by dragging and dropping them in the Tree
View.
- Add missing item attributes such as category, subcategory, or square footage
information. Always assign a category and
subcategory, and add square footage for
any facility in order for the weather normalization and MA DOER Green
Community reports to publish accurately.
- Review the unassigned accounts (listed at the bottom of your tree, or on the
accounts tab for you city or town) and figure out what they should be assigned to.
- Reject any accounts that are not yours. Only do this if you're really sure the
account belongs to your town. If it used to belong to the town, but doesn't anymore,
just mark it inactive.
- Click on an account name/number, and go to
the Assign/Reassign tab for that item and make
any necessary changes.
- To mark it inactive, go to the info tab for the account and change active to
"no".
- Add any items that are missing.
- Click on the parent folder where the item belongs.
- Go to the Items tab and make any necessary
changes.
- Add any accounts that are missing.
- Click on the name of the item where the account belongs.
- Go to the Accounts tab and make any necessary
changes.
- View the reports and familiarize yourself with your city or town's energy profile.
How is floor area defined and why is it important?
Floor area is defined using the Energy Star Portfolio Manager definition, which is gross
floor area.
Floor area is used to calculate energy use per square foot or what's known as the energy
use intensity - EUI - measured in kBtu per square foot per year. Without floor area
entered for all buildings, reports that use EUI as a part of evaluating energy
efficiency will not display/compare building performance accurately. To ensure
that these reports are accurate, all buildings must have floor area entered.
Note: Floor area entered for units is not summed to create building
square footage.
How should I enter vehicle and lighting data?
For vehicles: We recommend creating an item at the facility level
for vehicle fuel that represents tank-level fuel usage. Align this with the department
or building where you would like to see the data reported. Give that item a Category of
Vehicle. To do that:
- If the item already exists: Click on the item's name in the Tree view. Then choose
"Vehicle" from the Category drop-down on the Info tab.
- If you are creating a new item: Choose "Vehicle" from the Category drop-down on the
Info tab on the Create New page when creating a new item.
For example, you might have a filling station for your Department of Public Works
vehicles, and you want to show the use from this under the Department of Public Works:
- Create a Department of Public Works if you don't already have one.
- If you are using the Tree view:
- Click on the Create New button next to the
Department of Public Works and select Create New
Building.
- On the page that opens up, give the item a name like "DPW Vehicles," or
whatever you would like to call it. Make sure to choose Vehicle from the
Category drop-down menu.
- Click Submit.
- OR...if you are on the department's Info tab:
- Click on the Items tab and add the "Building" there.
- Click on the new building's name to go to
its Info tab.
- Change the Category to Vehicle.
- NOTE: If you have already created the account for the tank at the filling station,
attach that account to "DPW Vehicles." If you have not created the account for the
tank, you can do that from the Accounts tab for the DPW
Vehicles "building."
The fuel use for these vehicles will then be included in the Baseline report, and it will
be shown under DPW on the Overall Use and Emissions dashboard.
For lighting: Set up your lighting accounts in the same way as
vehicles.
- Choose where you want each to be reported and which department you want them to be
aligned with.
- Create two placeholder facilities, one for streetlights, and one for traffic lights.
Add each facility under the appropriate department.
- Choose "Street/Traffic Lights" as the Category.
- Choose either "Street Lights" or "Traffic Lights" as the Subcategory.
- Assign your lighting accounts to the appropriate placeholder facility, either
streetlights or traffic lights.
Video
- Streetlights and Vehicles
How should I track electricity used by standalone electric vehicle
charging stations?
Electric vehicle (EV) charging stations can be categorized as vehicles in MEI (see How should I enter vehicle and lighting data?).
- If a charging station is used exclusively for municipal vehicles, its account
should be entered into MEI, within a facility/node categorized as Vehicle, so electric use for municipal vehicle charging is
included in the Green Communities Annual Report.
- If a charging station is used for any vehicles outside of the municipal fleet, and
communities would like to track its electric use, its account should be entered into
MEI, and marked exclude from baseline on the facility info tab in Organize Data.
- A community may optionally choose to track municipal use of public charging stations
using manual data entry into a facility/node categorized as Vehicle.
Adding and Managing Accounts
How do I see the accounts in Organize Data?
To see your accounts you can either
- Click the box next to Show accounts within the Tree. This will
integrate your accounts into display of the Tree. Any accounts at the bottom of the
tree are unassigned accounts, and need to be assigned to the correct item before
their data is incorporated meaningfully into reports.
- Click on any item and then click on the accounts tab. This will show you the
accounts assigned to that item.
How do I add a new utility account to the Tree?
- Click on organize data to see the Tree.
- Click on the facility where you would like to add a new account.
- Click on the accounts tab, click on the Add New Account button, and fill in the
information requested in the new row at the bottom of the existing accounts list.
- If you don't see the name of your provider when you click on the Select a provider
box, contact support, and we can add it for you, or you can use "other".
- Double check your account numbers before entering them to make sure that they are
correct. See the question below about account number formats to make sure you have formatted it correctly.
See below for If I add new accounts or update/correct account numbers, how soon can I expect to see data from the utility?
Video -
Add a New Energy Account
What are "special ledger" accounts? Or why am I not getting data for my Eversource account number starting with 4000?
Eversource calls accounts beginning with 4000 "special ledger accounts." Data through FY24 needed to be entered into MEI manually for these accounts. The utility may now be able to include these accounts in the data transfer process. If you have special ledger accounts, check your latest bill, update the account number in MEI if needed to match the bill, and check with support after the next Eversource electric data delivery months if no recent data has been added to the account.
Does the way I format my account number matter? Do leading zeros
(zeros at the beginning) or hyphenation in my account number matter?
This question mostly applies for electric and natural gas accounts. Utilities sometimes
show the number on their bills in a different format than they provide in the data that
we receive from them. The account numbers that you see in MEI are formatted the same way
that they are formatted in the data that that utility companies provide to us. As a
result, those numbers may look a little different from what you are accustomed to
seeing.
When adding new accounts, be sure to format the account numbers in the same
way as accounts from the same provider are already formatted in the system.
- Confirm that you entered the correct number of characters.
- Include leading zeros if you see them in the system.
- If other accounts in MEI for this provider omit the hyphen, make sure to omit it
when creating a new account.
This way, when we ask the utility company for the data for that account, the number that
you added will match the way that the utility identifies the account. For example:
- Berkshire Gas: 12 digits (if you have a 14 digit number, remove the leading zero and the final trailing digit)
- Eversource electric or gas: 11 digits
- National Grid electric or gas: 10 digits (including leading zeros)
- Unitil: 10 digits (numerical only)
For each of the utilities listed above, remove any decimals, dashes, or spaces that appear in the number on the bill.
When I tried to create an account, I got an error that says "Not in
correct format." What does that mean?
This error means that the format of the account number you have entered does not match
the format for the provider and fuel you have selected. Look at a copy of the most
recent bill for this account to make sure that the account number has not changed. Also
be sure that you are entering the account number and not the meter number. It may be
helpful to take a look at other account numbers already in this system to get a sense of
what the correct format for the provider should look like. See the question above for
more formatting tips.
Do I need to include the meter number for each of my accounts?
No. You only need to include meter numbers for multi-meter accounts, where a single
account number has multiple meters. This is rare. See the question below on multiple
meters for the same account.
What if I have multiple meters for the same account? How do I assign
usage based on meters instead of by account number?
By the same account, we mean an account with the same utility/provider, fuel type and account number. Some utilities may use the same account number for different accounts, such as an electric and gas account, and that is not considered a multi-meter account.
For any utility accounts except National Grid gas, set up a separate account in MEI for each meter, each with the same account number, a different meter number, and Yes selected for “Multi-meter account?”
Note that utility companies change meters on a regular basis. If data is not loading for a multi-meter account, check a recent bill to confirm the meter numbers. If any meter numbers have changed, then go to the account Info tab and update accordingly. Data for the new meter should be loaded after the next data delivery cycle.
For National Grid gas accounts, we are not currently able to get data separately for each meter. Do not select yes under multi-meter for these accounts and do not enter a meter number, and then the data for all meters should show up in the same MEI account.
How do I add accounts that have the same account number?
Create them as distinct accounts, just like multi-meter accounts in the question above.
Use or create a meter number for each of the accounts.
For fuel oil, propane, gasoline, diesel, or other delivered fuels you can also have
accounts with the same account number if you list them with a different provider name.
If I add new accounts or update/correct account numbers, how soon can I expect to see data from the
utility?
We send data requests to each of the investor-owned utility companies (IOUs) on the 20th of each month at 5AM Eastern Time. Users should add or update accounts in MEI by the 19th for it to be included in that month’s request. We typically receive the data from most utilities and load it into MEI within several days, but they do sometimes fall behind. As of September 2025, Eversource is providing the data early the following month.
The Utility Data Updates table on the MEI homepage (shown in the lower right corner of massenergyinsight.net after logging in) shows when we last loaded data from each IOU.
The amount of historic data provided for new accounts (recently opened accounts or accounts newly added to MEI) varies by utility, with the major utilities generally sending at least one year of data.
See more information under Why hasn't my utility data been updated?
NOTES:
- IOU accounts added after the 19th will not be included in a data request until the following month.
- We collect/update data only from the major investor-owned utilities. We are not able to collect/update data from competitive energy suppliers, or oil or propane suppliers. To update competitive supply, oil, or propane energy use data, click Organize data and update the data one account at a time, or click Upload spreadsheet and upload your data by spreadsheet.
- The process and timing varies for municipal utilities, also known as municipal light plants (MLPs). Most MLPs periodically load their data into MEI through spreadsheet upload. Coordinate with your utility as needed, and contact support if you have questions.
What if an account number changes?
Never reject an account because it closed. That would remove historical data, which
must be retained in reporting.
When account numbers change, it is often due to a systemwide change in the
utility's data system. In that case we'll take care of updating account numbers in MEI.
If a specific account number is changing, take the appropriate actions below. In either case, we recommend noting the previous account number in the account notes field for future reference.
How do I reassign or move an account?
There are two ways to do this. The first option is to drag and drop the account in the
Tree.
- Click on organize data to see Tree View
- Click the show accounts within the tree box.
- Find the account that you would like to move.
- Click and drag the account up or down the Tree to where it should be moved, and
release it when the arrow points to the item you want to assign it to.
The second way is from within the account.
- Find the account in the tree, or on the accounts tab of the item it's assigned to.
- Click on the account number.
- Click on the assign/reassign tab.
- Click on the radio button next to the location to which you want to assign the
account.
- Scroll to the bottom and click the save button.
Video
- Reassign or Move an Account in the Tree
Why are there accounts at the bottom of the Organize Data Tree?
Accounts located at the bottom of the Organize Data Tree are unassigned accounts. These
accounts are associated at the municipal or agency level and should be assigned to lower
level items such as department, complex, facility, or unit.
Review the list of accounts that are associated at the municipal or agency level. To do
this you have two choices:
- Click the accounts button next to your municipal or
agency folder name. This will open a list of all accounts that belong to your
municipality or agency but are not yet assigned to a department or building. These
accounts all need to be assigned to the correct department or building before their
data is incorporated meaningfully into reports; or,
- Click the box next to Show accounts within the Tree. This will
integrate your accounts into the Tree. Any associated with your town name need to be
assigned to the correct department or building before their data is incorporated
meaningful into reports.
- See above for how to reassign accounts.
When should I mark an account inactive?
When an account has been closed or no longer belongs to your community/organization, it is important to mark it as inactive in MEI. Marking an account inactive means existing data will remain and continue to be counted toward your past energy use, but the account will not be included in future data requests to the utility.
This is important for two reasons:
- Utilities sometimes reuse old account numbers. If you do not mark an account inactive, we could continue to receive any utility data associated with that account number in the future, which would cause energy use by another utility customer to be incorrectly attributed to your organization.
- Marking old accounts inactive is a clear sign that they should not be receiving updated utility data. This prevents time from being wasted in the future to research data gaps.
Note that marking an account inactive is different from rejecting an account, which should be done only when an account never belonged to the municipality and none of its use should be counted.
To make an account inactive, go in organize data to the main info tab for the account and toggle the “active” status to “No”.
How do I remove an account?
MassEnergyInsight does not allow you to delete accounts. Given that the source of data
for accounts is not easily recreatable (but spread across years worth of files) the cost
of recovering accidentally deleted accounts is too great.
What we allow you to do is "reject" an account. Use this when you've accidentally
created an account with the wrong number, you have duplicate accounts, or if you find an account that actually isn't
yours.
When you reject an account, the account and its data stay in the system but are no longer associated with your city or town. If this is done in error, MEI support can restore the account for you.
To reject an account:
- In Organize Data, find the account you want to reject (either from the Tree View, or from the accounts
tab of an item).
- Click to open the account that you would like to reject.
- If it is a duplicate account, click on the account number to edit it and add "duplicate" at the end of the number.
- Click on the assign/reassign tab and click the "Reject" button.
- Video
- Remove an Account From Your Tree by Rejecting It
Do not use this method for closed accounts, or accounts for sold, closed or
demolished properties. Mark them inactive instead, which will keep the
historical data in your city or town and stop future data deliveries for that
account.
(See When should I mark an account inactive? or
Video:
Making an Account Inactive)
If an account is in the wrong place, simply move it or reassign it to another
location.
How do I edit account information?
To edit account data, go to the account in Tree View, and click on the account number or
go to the item where the account is located, click on the accounts tab, and click on the
account number. This will take you to the Info page for the account. Click on any box to
edit it, and hit tab, enter or click outside the box to save your changes.
Note that account numbers and the fuel type attribute cannot be changed. To change these
things you reject the account and create a new one. See the question above about
rejecting accounts.
Video
- Edit Energy Account Info and Use Data
How do I add a solar or other renewable account?
How to add a renewable fuel source account is dependent on where it is in relationship to
the meter. For conventional net metering (behind the meter), the user should create a
separate solar account in MEI, and manually enter the solar production, except for facilities in which Eversource is the electric utility - see information on that situation here. See more
information on the different scenarios and how to handle them in MEI in the Green Communities Renewable Energy
Guidance. If you have questions about if an account should be included in MEI,
contact your Green
Communities regional coordinator.
Should I add a
Virtual Net Metering account?
Communities do not need to add virtually net metered accounts or data in MEI. Virtual net
metering is a special situation where the value of renewable energy generated under one
utility account gets credited against the bill of another utility account or set of
accounts. With virtual net metering, a renewable energy system has its own account and
receives a monthly "billing" statement from the utility. The billing statement documents
the renewable energy system's electricity production, calculates renewable energy cost
payments, and explains and documents how the renewable energy generation cost payments
were allocated to other accounts. If you have questions about if an account should be
included in MEI, contact your Green Communities
regional coordinator.
How do I create a Competitive Supplier account?
There are two options to create competitive supplier accounts in
MassEnergyInsight. Both options require adding the competitive supply account directly
into the utility company account competitive supplier tab. The first option (the
preferred option) is to add the account as the utility account number, with an "S-" (for
supplier) as a prefix. This is a good method if you don't want to have to add new
accounts everytime you change supplier contracts. We call this the "S-" account method.
The second option is to use the competitive supplier account number, but you'll have to
add new ones each time you change suppliers.
Options 1 - the "S-" account method
Each competitive supplier account must be associated with a particular utility account.
Follow the process below to set up your competitive supply accounts and load in your
data as an ?S-? account:
- In the Tree View under Organize data, click on the name of the
building that the associated utility account is currently assigned to.
- Click on the account number for the utility account with which the competitive
supplier account is associated.
- Click the ACCOUNTS tab.
- Click on the COMPETITIVE SUPPLY tab.
- Click New competitive supply accounts.
- Choose "Other".
- Type S- in the account number box, and then copy and paste the account number from
the screen above the tabs. This will make sure you get the right account number. So
if your utility account number is 444444, you'd be creating a supply account under
that utility account named S-444444.
- Click Add
You'll now load your competitive supply data using this "S-" account number, regardless
of who the provider is. There's a simple way to do this. If you get a spreadsheet of
data from your supplier, they usually already include the utility account (sometimes
labeled as LDC account) in a column in the spreadsheet they give you. Create a new
column next to it, and use the CONCAT function to combine "S-" and the account number.
See you your spreadsheet's help for how to do this.
Option 2 - use the actual competitive supply account number
Follow the process above, but use choose the supplier from the provider list, and use the
supplier account number.
NOTE: Check for accuracy before moving on. It is very important that
you select the correct competitive supplier for each utility account. If you do not see
your competitive supplier in the drop down list please contact Customer Support.
How do I set up energy accounts that serve a complex or more than one facility?
There are a few options for how to handle a utility account or fuel deliveries that serve a complex or multiple facilities (with no submeters), each with pros and cons:
- Create a complex containing the relevant facilities and set up any shared account(s) at the complex level
- Energy use for the shared account(s) will not be associated with the individual facilities, which means EUI values for the facilities will be incomplete
- Each facility can be categorized accurately, but complexes cannot currently be categorized in MEI, so the energy use at the complex level will not be categorized
- If any of the facilities in the complex are excluded from baseline, their use in that account will still be included in community totals
- Set up MEI as described in the previous bullet, and send a request to MEI support to set up the Energy Allocation Table, which is only accessible at the administrator level, to automatically distribute each energy use entry for the shared account(s) between the facilities based on percentages you provide
- The distribution will be based on approximate percentages and assume consistent distribution over time (if there are significant changes, contact support to request changes to the table)
- Each facility can be categorized accurately
- Approximate energy use for each facility will be included at the facility level and reflected in the EUI value and in the category totals
- Once this is set up, see the Category View Table for the allocation of usage between facilities in the complex (Organization View Table currently shows the energy use at the complex level)
- For facilities syncing to ENERGY STAR Portfolio Manager (ESPM), these allocations are not currently able to sync as they show up in MEI. All usage in ESPM is assigned to whatever item the account is formally assigned, meaning it will show at the complex level in this configuration.
- Combine the facilities that have shared account(s) into one MEI facility
- Only one category can be selected for an MEI facility, so if the actual facilities belong to different categories (for example, a town hall and library, or a school and open space), some energy use will be miscategorized
- This may not be possible for groups of facilities that need to be set up as a complex in MEI to meet Large Building Energy Reporting (LBER) requirements
Entering and Editing Data
How do I edit utility bill information that is already loaded?
Most data for your city or town will come in from the utilities. Utility bill data
supplied by utilities (or data entered manually) may have errors. Some but not all
utility data can be edited. Users can edit data entered manually either for an
individual entry or with the spreadsheet upload feature. Users cannot edit data provided
by the major utility companies. Users can contact support to delete incorrect data.
Users can also create a parallel account to correct data (described under Why do I see gaps in utility data or why doesn't the data in the system match my records (e.g correction bills)?), but we recommend contacting support first.
To edit manually entered utility bill information:
- Navigate to the account, and click on the account use tab.
- If you are allowed to edit a utility records, the fields will be editable when you
click on them.
- The symbol at far right deletes the entire line.
What if the utility data in the system does not match my records?
The utility data our system reflects the way that the utility companies send it to us. It
should generally match your bills. One potential cause for utility data in the system
not matching your records is a corrected bill. Please refer to the section below on correction
bills for more information.
As detailed below, correction bills can cause a gap in utility data, but this is only an
issue if the annual total does not match your records or if a multi-month entry spans two or
more reporting years. In these cases or if you have other concerns about utility data in MEI
not matching your records, contact
MEI support.
How should I address issues with Eversource solar data? / Why does my Eversource electric account have multiple usage entries on the same date?
As of spring 2026, the MEI team is continuing to work with Eversource on remaining issues from their 2024 software change, including data for facilities with solar PV.
For some Eversource electric accounts, the usage values currently in MEI also include solar generation. In the longer term we are hoping to get additional information from Eversource that would allow us to separate these records into solar accounts in MEI, so solar data would be properly tracked automatically.
For now, please go to each of your Eversource electric accounts in Organize Data and review the Use table. If you see solar data already included (we expect this would show as a separate row for each month), don't upload/enter that same data in your separate solar account. If you have entered any duplicative solar data, it should be deleted. (Note that we rarely advise users to delete anything from MEI; this is a special case.) This way your total electric use will be accurate in your report, though the solar data won't be correctly identified yet. Note that these duplicate entries may date back to spring 2024; if you entered FY24 solar data as one annual value, you can update that entry to eliminate any double counting.
If you have an Eversource electric account showing multiple entries for the same date on the Use tab in Organize Data, it is probably either a multimeter account that wasn't entered as such in MEI or a facility with solar for which the solar data is now being provided by the utility as described above.
Why do I see gaps in utility data or why doesn't the data in the
system match my records (e.g correction bills)?
Utility companies issue corrected utility bills if you or the utility company identifies
previous errors, or if the utility estimated one or more meter reads. Errors can include
incorrect application of taxes or rates, incorrect supply costs, meter malfunctions,
etc. When the utility issues a corrected bill, they also cancel the bills that are being
corrected and remove them from the data that they deliver to MEI. As of fall 2022, the
canceled bills are automatically removed from MEI, so you may see gaps in your data, but
the bill following the gap should show the total amount for multiple months. The
timeframes of the corrections and canceled bills can vary widely, from one month to more
than a year.
Corrected bills only pose a problem for MEI when they span two reporting years. If your
town uses fiscal reporting years and a multi-month correction bill spans the June
30/July 1 fiscal year divide, then the bill should be split into separate bills
representing the estimated portion of the usage in each fiscal year. If your town uses
calendar reporting years, then the same action must be taken for large correction bills
spanning calendar years. If you identify one of these situations, contact MEI support for
assistance.
In most cases, no further action is needed by the town.
If your town has a strong preference for usage from a correction bill to be spread across all of the months covered by that bill, then
you can upload adjustments to the account on a dummy correction (or "C-") account, but
that is not required and may adversely impact the accuracy of the MEI weather
normalization calculation. If making this adjustment, it is important that the
redistribution be as realistic as possible, especially in accounts with large heating or
cooling consumption. If your monthly usages do not correlate well with monthly weather
data, it can result in poor weather normalization results. If you are dealing with a
multi-month correction bill in an account with large heating or cooling loads, we
recommend you contact support for assistance. To make create a correction account
redistribution follow these steps:
- Create a new account under the same facility that this account belongs to. For the
account number use "C-" (without the quotes) followed by the utility account number.
This will be your dummy correction account.
- Calculate the difference between the current use and cost reported in MEI and the
target use and cost for the month with the bill correction. The difference will be
the adjustment you put in the spreadsheet for the month with the bill correction.
(You may also opt to have one negative entry that is the full value of the
correction bill and a second on the same date that is the amount you want for that
month.)
- Determine the usage and costs for the other months covered by the correction bill.
- Confirm that the total use and total cost for all entries sums to zero.
- Create a spreadsheet using the template on the Upload a Spreadsheet page (this link
to page only works if already logged in to MEI) with the monthly use and cost
information you want to load. Use the new C- account as the account number for the
corrections.
- Follow the instructions in the Upload a Spreadsheet section to load this data.
What happens if I enter data for utility accounts before the data arrives from the utility? Will manual data entries or changes to utility data be overwritten?
Investor-owned utility companies provide historic usage data to MEI monthly (how far back that data goes depends on the utility and account), but that data does not overwrite manually entered data (entered either directly in the account use tab or with the spreadsheet upload feature) with the exact same "To Date".
If you manually delete utility data entries from MEI, they will likely be added back in the next data delivery unless you add new entries with the same To Dates. Contact support if assistance is needed with this.
Which fuel grades are accepted in the system?
The fuel grades used must be one of the following accepted values:
Gasoline/Diesel
Gasoline/Diesel - Diesel
Gasoline/Diesel - Gasoline
Oil
Oil -
Kerosene
Oil - No. 1
Oil - No. 2
Oil - No. 4
Oil - No. 6
How do I enter utility data on my own?
Users must enter data for oil, propane, wood, municipal utility company water,
electricity, and gas accounts, and competitive supplier accounts, as MEI is not able to
populate that data for you. You can enter data on your own either by entering records
for each account one at a time (manual data entry), or by uploading an entire
spreadsheet of data for many accounts in bulk (spreadsheet or bulk upload).
Manual Data Entry
Entering records one at a time is helpful if you want to enter a small amount of data.
- Navigate to the account, either from the Tree (with Show accounts in the tree
activated) or by going to the item that the account is assigned to.
- Click on the account, and then click on the use tab.
- Click the Add Use button.
- Enter the account data in the boxes, following the instructions on the page. Click
save.
- Remember that cost is not the same thing as price. Cost is use times price. Be sure
to format the data correctly, particular the date format.
To enter data for another account, navigate to the next account and repeat the process.
Video
- Add Energy Use Data Manually
You can enter the data for each account in bulk. This is helpful if you want to enter a
large amount of data. See the next questions
When and how do I upload a spreadsheet of data?
Use the Upload a Spreadsheet feature when you need to enter a large amount of usage
data. This includes several months of data for a single existing or new account, monthly
data for several existing or new accounts. It also includes uploading a spreadsheet
report that you have received from an energy provider.
- Follow the instructions below to format your spreadsheet. Starting with this template might be helpful (the fields with asterisks (*) are required)
- Click Upload Spreadsheet in the top navigation
- The onscreen instructions will take you step-by-step through the upload process.
- Here are some important things to know:
- You can upload either an .xls or .xlsx file
- Each file can contain multiple worksheets of utility data, but you can only
upload one tab at a time.
- Each worksheet should contain data for only a single fuel type and fuel
provider. The spreadsheet can contain data for more than one account.
- Use whatever column headers work for you. You will map them to the fields in
the system on a later screen.
- For any utility accounts that have already been set up in MEI, the account numbers in the spreadsheet must exactly match the numbers already in MEI. Check formatting of account numbers (number of digits, dashes, etc.) to make sure they match.
- The fuel grades used must be one of the accepted
values.
Tip: Two common spreadsheet upload errors include:
- Formulas - check to make sure there are no formulas in any of the cells that you
intend to load in the spreadsheet. Excel has a function for this: Edit > Find
> Go to... > Special..., check the Formulas radio button and hit OK. It should
let you know or highlight the cells with formulas. If you find formulas, you can
make a copy of the sheet and name it something like "for upload", and then select
the entire sheet, copy it, and then do Edit > Paste Special > Values. That
will get rid of the formulas. Formulas can be left in worksheet columns that are not
mapped to be loaded up.
- Date Format - Right click on the column header (where the letter is) for the date
columns and choose Format Cells..... Check that they are formatted as date.
If you don't find either of these errors and the file doesn't upload, Send a request to
Support and attach the spreadsheet for our review.
Video -
Uploading a Spreadsheet
What kind of spreadsheet file can I upload?
The system accepts Microsoft Excel files in the .xls or .xlsx formats.
How should I organize my spreadsheet file before uploading it?
Use whatever column headers work for you. You will map them to the fields in the system
on a later screen. The important thing is that your account numbers are listed in the
left column, and data associated with each account extends in rows to the right of each
account number
Remove all rows that contain anything other than column headers or energy use data.
I'm trying to upload a spreadsheet and can't find my provider/supplier. What
should I do?
Make sure you have selected the correct Fuel Type, the list updates based on fuel type.
If you still don't see it, contact support and we can add it for you.
When do changes to the Tree or data show up in the reports?
Changes that you make to the Tree will show up immediately in Tree View. However, changes
made in the organize data tree view do not appear instantly in the report views. The
report views refresh nightly (except Saturday nights) and will reflect changes that you
have made in the organize data tree view the next day. Exceptions to this rule include:
- Item changes, account changes, manual and bulk load utility data additions, and
organization changes will show up in the reports the next day.
- Weather normalized reports are refreshed nightly.
- Investor-owned utility account data updates when we receive data from the utility
company. See our FAQ If I add new accounts or update/correct account numbers, how soon can I expect to see data from the
utility?
- Changes to Investor-owned utility accounts update when we reload utility data each
month. This assumes that the utility company is providing data for the account
already. Examples for this situation include:
- Corrections to account designation such as multi meter (yes or no).
- Multi meter accounts where the meter number has changed.
Why hasn't my utility data been updated?
On the MEI home page, we post the most recent date that we uploaded data for each
investor-owned utility. Make sure you are logged in, then go to http://massenergyinsight.net and check the
Utility Data Updates table in the lower right corner. We try to update that table with
known delays in receiving utility data. See more information under If I add new accounts or update/correct account numbers, how soon can I expect to see data from the
utility? and Does the way I format my account number matter?
If you added your account to MEI before the latest data request (check the account creation date in organize data on the accounts tab for that facility) and no data was added on the date posted, you should first confirm that the account number is correct (check against the number shown on your latest bill) and formatted correctly in MEI, and if you don't see anything that needs to be corrected, contact support.
What do the values under Read Type mean?
In Organize Data, the Use table has a column called Read Type. These are the meanings of the values you may see for Eversource data:
- AMR – Handheld – Automated Meter Read hand-held read device (meter technician has to physically walk up to meter).
- AMR – Mobile – Automated Meter Read, mobile unit. Meters are read from a vehicle mounted antenna and read device.
- Automatic estimation – Typically performed when a meter is inaccessible on the read due date. Typically due to weather, holiday, etc. The read is estimated based on past usage, and corrected when an actual reading takes place (a bill, cancel, rebill takes place in the MEI output file).
- Interval Read – Read from a time-of use-meter. Reads are typically in 15-minute intervals, depending on meter settings.
- Manual Correction – Actual – Billing system record update from actual meter read.
- Manual Correction – Estimate – Billing system record update from system estimate based on previous usage history.
- Meter reading by utility – Manual or device collected read.
- Meter reading interpolated – Estimated read based on historical read data.
- Regular Read – Normal manual or device collected read
For older data (spring 2024 or earlier):
- A – Regular Actual Reading
- B – Customer Phone in or Card Reading
- E – Computer Estimated Reading
- M – Manually Estimated Reading Local Office
- P – Prorated Read
- Y – Inside Telemeter Reading
- SP – No read
Weather Normalization
What is weather normalization?
MassEnergyInsight provides building level weather normalized energy use data. Weather
normalization attempts to remove the effects of a hotter or colder year when asking the
question "did my facility perform better or worse compared to other years?" Weather
normalization returns a value in MMBTU/year that can be compared to other weather
normalized years.
What's included in the weather normalization process?
Only energy use data for items categorized in MEI as buildings is weather normalized.
Energy use data for Open Space, Street/Traffic Lights, Vehicle, and Water/Sewer
categories is not weather normalized. Diesel and gasoline energy use for buildings is
not weather normalized (we have found that most of this energy use data is actually
incorrectly labeled vehicle fuel use). Water usage is also not weather normalized.
Do I need to do anything special with my data for it to be weather
normalized?
Maybe. The weather normalization analysis needs at least 365 days of data for each fuel
used in a building to properly run. Given that we don't have start dates for most
utility records, we don't look at the start date field, but the end date of the previous
record.
For gas and electricity, this means that you need 13 bills before you will get a weather
normalized value. For delivered fuels, you need to have end dates spanning at least a year.
If you don't have data loaded in the year previous to the baseline year or any following
year, you should manually add an entry to at the end of the previous year to set the start
date for that data. The manual entry can be a dummy record with zero usage.
Where can I see the results?
This weather normalized energy use is provided in the follow reports:
- Baseline - Weather Normalized
- Annual Building Energy Use - Weather Normalized
- Weather Normalized Building EUI
- Bill Alerts
- Table 2 - used for annual reporting to DOER.
Some more detail on the Weather Normalized Building EUI report: In addition to annual
energy use, the weather normalization analysis provides a weather normalized Energy Use
Intensity metric (EUI) in kBTU/square foot/year. The weather normalized EUI tells you,
each month, how your building performed the last twelve months, and lets you see changes
in performance without having to wait a full calendar or fiscal year. By looking at the
trend of this metric over time, you can see if your building is getting more or less
efficient, by each fuel type.
How does it work? (the simple version)
Energy use is compared to outdoor temperature during the read period for a given fuel's
bill. Variations in fuel use over the year are compared to variations in temperature,
and a model building energy use profile is created that describes how much the
building's energy use changes with the temperature. This allows the model to calculate
how much of the change in energy use from one 12-month time period to another is due to
changes in temperature.
The model then adjusts the energy use to show what the building would have used in an
"average weather year", based on 30-year average daily temperatures. This adjustment
provides year-to-year comparisons that compensate for temperature, allowing you to see
how changes to the building and its operation impact the building's energy use
independent of year-to-year changes in temperature.
How does it work? (the detailed version)
For those who like more detail, the analysis uses a process with over thirty steps,
grouped here into three larger steps.
Step 1 - Combine Usage by Fuel Type for a Building?
In most cases the energy use for each gas and electric account is checked for temperature
dependence individually, meaning the weather normalization is run on account level data.
But some fuel types need to be combined before being weather normalized.
- When a building has multiple accounts for a delivered fuel (e.g. oil, propane) for a
single building, the energy use for those multiple accounts is combined before the
analysis is run.
- If there is renewable energy system production data (solar electric or wind power)
in one account, and grid-based electric energy use in another account, these
accounts are combined so that total electric energy use can be computed for the
building. Please let support know when you add a behind the meter renewable
energy account, and which utility account the meter belongs to. This
lets us match the RE system to the utility account for the analysis.
- Fuel deliveries within a few days of each other are combined to the same bill date
to give a more realistic picture of delivered fuel usage patterns.
Step 2 - Match Bill Data to Weather Data
Each building is matched with a nearby weather station. Each bill period record is then
matched with temperatures for that weather station, both for the actual average daily
weather during the bill period and for average weather year data for that time of year.
The actual weather data will be used in the next step to determine the pattern of use
for the building.
The average year weather data is used to weather normalize the usage data, creating a
weather-independent measure of building performance for use in longitudinal tracking.
The actual and average year weather data are sourced from National Oceanic and
Atmospheric Administration (NOAA) and can be found at these sites:
Step 3: Regression Analysis
The combined energy use data from Step 1 and the temperature data from Step 2 are
analyzed for each building, and used to identify a building energy use profile. The
energy use in the building will go up or down with average temperature in one of 5
patterns, depicted by the graphs in the image below. The analysis matches the building
with the graph that is the best depiction of the pattern of energy use in your building.
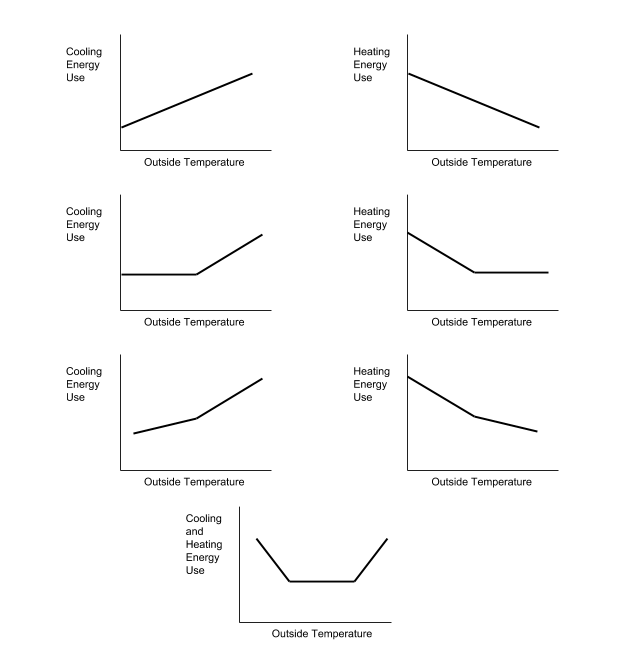 These graphs are based on the graphs from the
paper KC-03-02-1
(RP-1050) -- INVERSE MODELING TOOLKIT: NUMERICAL ALGORITHMS by John Kelly
Kissock, Ph.D., P.E.; Jeff S. Haberl, Ph.D., P.E.; David E. Claridge, Ph.D., P.E. These graphs are based on the graphs from the
paper KC-03-02-1
(RP-1050) -- INVERSE MODELING TOOLKIT: NUMERICAL ALGORITHMS by John Kelly
Kissock, Ph.D., P.E.; Jeff S. Haberl, Ph.D., P.E.; David E. Claridge, Ph.D., P.E.
We test models from the most complex to the simplest (bottom to the top). We adopt the
first model that passes the statistical tests, and therefore the one that matches the
use pattern most closely. The statistical tests each model must pass to be used are:
- The pattern of use must be correct, for example, if it is a heating model, the usage
must go down as the temperature increases. In terms of the regression model, this is
equivalent to requiring that the slopes of the regression lines have the right sign.
- There must be enough bills to specify the slope and location of each line in the
model. Since some of the bills in each year are in the heating season, some in the
shoulder seasons, and some in the cooling season, this requirement means there must
be enough bills that fall in each line segment of the model. In terms of the
regression model, this is equivalent to requiring that there be adequate degrees of
freedom in each segment of the regression.
- If the model includes heating or cooling usage, then we must have adequate
confidence that the usage decreases as temperature increases during the heating
season, and increases with temperature during the cooling season, respectively. In
terms of the regression model, this is equivalent to requiring that the slope of any
heating or cooling segment have a p-value less than 0.1.
Matching the data to a profile and generating a model also allows the analysis to
generate a weather normalized annual MMBTU usage, by adjusting the annual use to what it
would have been in an average weather year. This weather normalized annual use is a
weather-independent measure of building performance that can be used for longitudinal
tracking.
Step 3 also computes a weather normalized EUI for the last twelve months. These values
are generated for each month's bills, combining it with the last 11 months of data for a
12-month period of data (technically at least 365 days of data). We refer to this as a
sliding analysis, and it helps give a month by month picture of the building's
performance over the last twelve months, rather than having to wait a year to use a
calendar or fiscal year's worth of data.
This sliding EUI can be used to determine building energy performance trends over time.
Using the model, during each new bill period, the actual use is compared with the
expected usage for the average temperature, given the model's prediction. If the usage
is significantly higher or lower than expected, a Bill Alert is generated, meaning it's
worth taking a look to see if something unusual is going on with the utility data, the
utility meter, the building, or the building's operation.
Why did my weather normalized values change?
Weather normalized values can change for a number of reasons. The most common reasons are
changes to the underlying data itself. These changes could include:
- Accounts added, rejected, or marked/unmarked as "exclude from baseline"
- Data uploaded or deleted
- Bill adjustments from the utilities via automatic upload
- One off data corrections implemented by MEI staff
Most of these changes would also result in a change to the non-weather normalized totals
as well. In some instances a change may only alter bill dates or lengths (e.g. additions
of a zero bill to mark the beginning of a period), which could change the weather
normalized values, without changing the raw totals.
There can also be system wide changes that impact the weather normalized values. These
changes could include:
- Bi-monthly additions to historical weather records (will only impact recent bills)
- Updates and improvements to the weather normalization algorithm (rare)
- Updates to the average year weather data - released by NOAA every 10 years (last
update in October 2021)
Reports
Where can I learn about the new reports?
New reports were launched in June 2024. You can learn about them in these slides. We are working to update the rest of the FAQ accordingly.
How do I find the new report that replaces an older report?
| Old Report |
New Report |
Instructions |
| Annual Report Table 2 |
Category View Table or Annual Report Table 2 |
|
| Annual Usage Patterns - Town |
Facility Dashboard for individual facilities, no equivalent for whole town |
|
| Baseline |
Overview |
|
| Baseline - Weather Normalized |
Category View Table (Weather Normalized) |
|
| Bill Alerts |
No equivalent yet |
|
| Building Benchmarks |
Buildings To Target |
|
| Building Dashboard |
Facility Dashboard |
|
| Buildings to Target |
Buildings To Target |
|
| Data Loaded - Detail |
Data Loaded Table |
|
| Data Loaded - Overview |
Data Loaded Table |
|
| Emissions over time |
Organization View Table for data, no equivalent chart |
Set Metric to MTCO2e |
| Emissions Tables |
Organization View Table |
Set Metric to MTCO2e |
| Energy Reduction Plan Guidance Table 3 (Emissions CO2e) |
Category View Table or ERP Guidance Table 3 |
Expand to Category to Facility, set Metric to MTCO2e, check Show Fuels box |
| Energy Reduction Plan Guidance Table 3 (Fuel Units) |
Category View Table or ERP Guidance Table 3 |
Expand to Category to Facility, set Metric to Native Units |
| Energy Reduction Plan Guidance Table 3 (MMBTU) |
Category View Table or ERP Guidance Table 3 |
Expand to Category to Facility, set Metric to MMBtu, check Show Fuels box |
| ESCO Report - Annual Data |
Category View Table or ESCO Report |
Expand to Category to Account, set Metric to Native Units, check Metadata, click Facility column label to sort by facility name |
| ESCO Report - Building Level Usage (MMBTU) - Calendar |
Category View Table |
Expand to Category to Facility, set Metric to MMBtu, click Facility column label to sort by facility name, change Year Type to Calendar |
| ESCO Report - Building Level Usage (MMBTU) - Fiscal |
Category View Table |
Expand to Category to Facility, set Metric to MMBtu, click Facility column label to sort by facility name |
| ESCO Report - Monthly Data |
ESCO Report |
|
| Monitoring Cost Dashboard |
Organization View Table, no equivalent chart |
Set Metric to Cost ($) |
| Monitoring Use Dashboard |
Organization View Table, no equivalent chart |
|
| Overall Use, Emissions and Cost Dashboard |
No equivalent chart, data available in various reports |
|
| Setup Completeness Dashboard |
No equivalent, but similar features coming soon in other parts of the application |
|
| Town Trend Dashboard |
Overview |
|
| Use and Cost Tables |
Organization View Table |
Set Metric to Use and Cost |
| Use and Cost This Year to Last |
Overview |
|
| Weather Normalized Building EUI - Annual |
Category View Table (Weather Normalized) |
|
| Weather Normalized Building EUI - Rolling |
No equivalent yet |
|
| Weather Normalized Building Use |
Facility Dashboard (Weather Normalized) |
|
When do I need to make corrections to address Null values in my reports?
Corrections need to be made to your organization tree if you see Null in certain places in your reports:
- If you see Null under Category or Subcategory, it means that facility needs to be categorized properly. Go to that facility in Organize Data and select the appropriate category and subcategory on the Info tab.
- If you see Null under Facility, it means you have accounts that need to be associated with a facility. Go to that department in Organize Data, click on the Accounts tab, click the account number, go to the Assign/Reassign tab, click “Choose new assignment”, and then select the appropriate facility.
- If you see Null under Department, it means you have some facilities that have not been associated with a department. This is allowed, but you may want to set up departments in Organize Data to help keep your facilities organized, especially in larger communities with many facilities.
- If you see Null under Complex or Unit, it is fine. Use of those organizational tiers is optional.
If you take the steps above and still have Null values in the Energy Summary of your Annual Report, contact your Regional Coordinator.
Definitions
Page - A page is what you see on the screen when you are in MEI. The
default page is the Home Page. Every page in MEI can include a report, access to
information about MEI, or access to actions that you can take.
Report/Reports - In MEI we use the term "report" to describe the
individual pages that are accessible via the individual tabs and the drop down list in
the View Reports section, and we use "reports" to describe this collection more
generally. For example, you can go to the reports section of MEI to
view the Baseline Dashboard report.
View - In MEI, a single chart or table. In may be on its own tab in a
workbook, or on a dashboard as one of many views.
Dashboard - A dashboard in MEI is something that has more than one view
on it. If a car had one gauge, you'd call it a gauge, not a dashboard. Dashboards in MEI
include multiple views.
Workbook - A workbook is made up of any number of views and/or
dashboards. When you go to View Reports, and you click on "MassEnergyInsight", you are
opening a workbook that contains Views and Dashboards.
How do I find my reports?
- Click View your dashboards/reports in the Home page "What
to you want to do?" welcome window; or,
- Click View reports in the navigation bar. The navigation
bar is located in the upper left hand corner of the page.
- You will see a list of workbooks available to you. Click on one to open it.
- The reports workbook will load. The different views and dashboards are a available
either via the tabs at the top of thew workbook, or from the downward pointing arrow
in front of the first tab in the workbook.
Using filters to modify reports
The reports are all interactive and you can change filters to modify reports on the fly.
Filters are generally on the right, and may be checkboxes (allowing more than one
selection at a time), radio buttons (allow one selection at a time), pull down menus,
search boxes, etc.
You can also filter by clicking on items in the reports and choose to exclude them or
"keep only" them. You can choose more than one item at a time by ctrl clicking (PC) or
command clicking (Mac). You can also drag on the view to select data to keep, exclude,
or see the data for.
Video
- Use Filters to Modify Reports
How to use the drill down feature to see more detail in reports
Some columns are expandable to drill down to more detail. If the functionality is
available, when you hover over a column header, a + sign will appear. Click it to expand
the level of detail. Hover in the same spot and click the - sign to collapse it again.
Video
- Drill Down to See More Detail in Reports
How do I change my report so that it excludes or includes specific
items, such as departments or buildings?
Mouse over the item that you want to exclude - for example, a bar in a bar chart. A box
will appear with the options to "keep only" or "exclude."
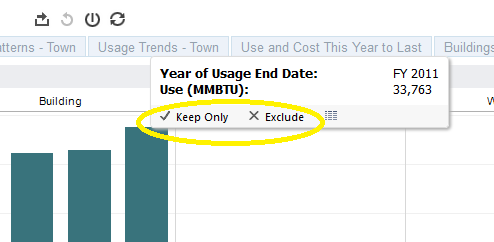
To exclude an item from your report, select "exclude." The report will redraw without
that item. To see the report with only that item in it, select "keep only." The report
will redraw with only that item showing. To keep only or exclude multiple items, click
and drag your mouse to select those items (indicated with the dotted line in the image
below). ?
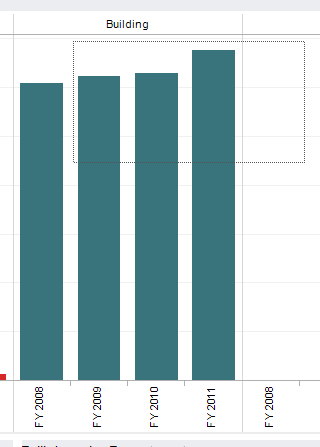
Then mouse over the selected items, and choose "keep only" or "exclude" in the pop-up box
that appears.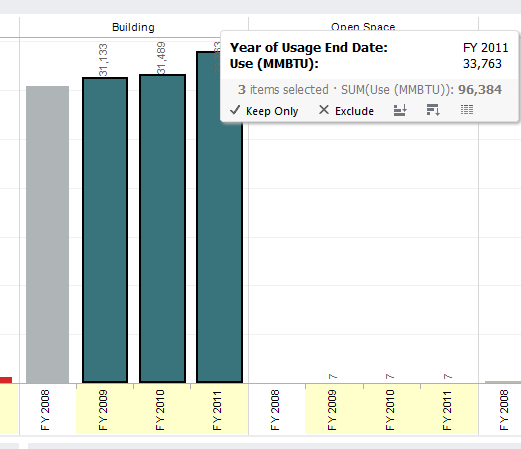
How to download images of reports, or the data behind them
To print reports or download data, use the download menu in the toolbar. There are
various download options, but not all are available in all cases - this will be clear
from the menu, as non-available options show in grey.
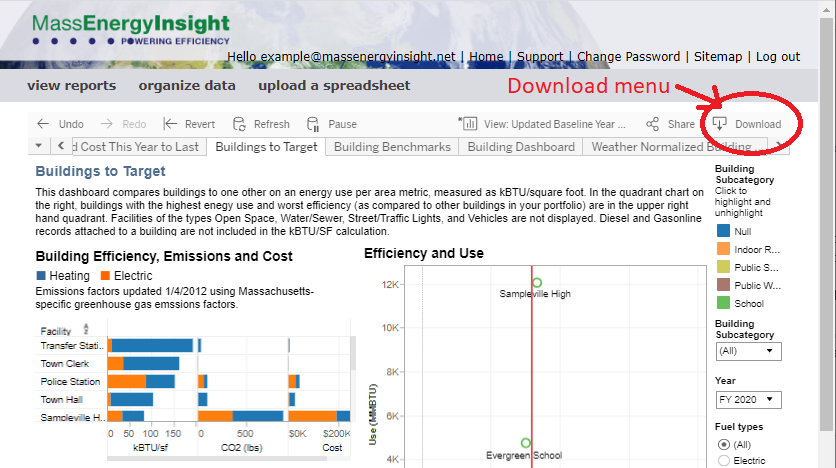
Images
You can download reports as PNG images, PDF files, or PowerPoint slides. Click on the
Download menu item in the toolbar, and choose the format you want. The PDF option allows
you to select the whole report or a specific chart within the report, or to select any
number of reports within a single download. The PowerPoint option creates a slide for
each tab. Make sure to set up all the reports with the filters and selections you want
before initiating the download, so that they show accordingly in the downloaded
document.
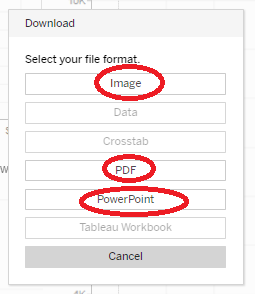
Data
You can download data behind any of the views in the reports:
- Set selections and filters to show what you want.
- Click on the item for which you want to download data. This will typically be the
left side or Y-axis of the graph. In some tables, you can select a subset of data to
download, for instance a specific Department or Facility (you can also make multiple
selections by using the shift or control buttons).
- Once you've made the desired selection (it will show as highlighted in blue), click
on the Download menu, and select an option.
- Data - this is the row level data behind the view. Clicking this
will open a new window with two tabs:
- Summary: This tab gives you the specific data points used
to create the view.
- Full data: This tab gives you the underlying data used to
calculate/derive the specific data points make up the view. Click
show all columns to see all associated columns of data for
each row, including columns not used in building the report.
- On either tab, click download all rows as a text file to
download the data you see as a .csv file, which can be opened by a
spreadsheet program such as Microsoft Excel.
- Crosstab - this is the table version of the view, delivered in a
csv file.
You can also click on any element within a chart or table, such as a particular bar
within a bar chart, and download the data associated with that element.
- Hover over the item/element.
- A box will pop up. Click the view data icon in the box.
- This will open a window similar to the Data window above, but with data just for the
selected item(s).
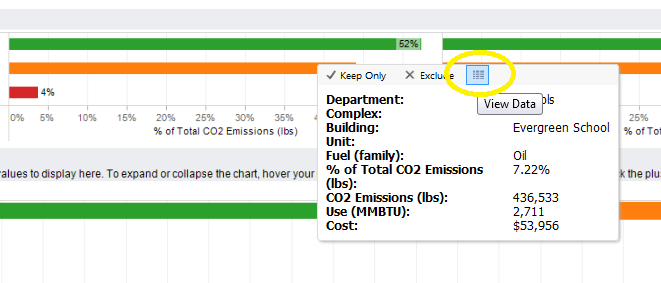
Green Communities Annual Reports
Where can I find the annual report template and reporting instructions?
We launched a new and improved annual report form in MEI in October 2023, in place
of the previous spreadsheet-based report. You can access the form by logging in to MEI and
clicking on Annual Reports in the menu bar near the top of the screen. Training on annual
reports is available at the top of the MEI Training Videos page.
Communities with errors in Eversource West (formerly WMECO) solar data should see this note about how to address
those issues in their annual reports.
What is the schedule for annual reporting?
Green Communities annual reports are due in the fall, with the due date set each year. We will update with more information here as the next reporting deadline approaches.
How do I exclude a building from my Baseline?
In some cases DOER will allow you to exclude a building from your energy use baseline.
You must have approval from DOER to exclude a building from your Baseline.
- Click on Organize data.
- Find the building that you want to exclude.
- Click on the building name.
- You should be on the Info tab. Look in the right column, where it says
Exclude from baseline.
- Select Yes, then click OK.
Large Building Energy Reporting
What is Large Building Energy Reporting?
Large Building Energy Reporting (LBER) is the legislatively mandated policy requiring the annual disclosure of energy data for buildings in Massachusetts that are 20,000 square feet or greater. LBER reporting (on the prior calendar year's energy data) is due annually on June 30th.
How is MEI involved in LBER?
LBER uses ENERGY STAR Portfolio Manager (ESPM) to take in energy usage data for buildings covered by the policy. ESPM is a free, web-based tool that the US EPA provides for building owners to measure, track, and benchmark their energy, water, waste, and greenhouse gas (GHG) emissions.
The MassEnergyInsight to ESPM Wizard is available to help municipalities and state entities that don’t already have ESPM accounts streamline their LBER process.
Municipalities can use the wizard to push their data from MEI to ESPM. State entities may use the wizard or have DOER’s Leading By Example Division submit their data. To access the wizard, after logging into MEI, select ESPM from the toolbar. This will bring the user to a beta version of MEI that will guide the user through the process.
Does LBER require updating of energy data in MEI?
LBER requires energy data to be reported for the calendar year. Users should verify that their energy data, including any manual entry or delivered fuels like propane, oil, or behind-the-meter solar, should be updated through the end of calendar year being reported.
What if I already have an ESPM account that I want to link to MEI and use for LBER?
MEI users who already have ESPM accounts should contact support for assistance: pfsupport@optimiserenergy.com
Should I share all of my buildings or just buildings 20,000 square feet or greater?
This is up to the user. LBER requires reporting of buildings 20,000 square feet or greater. The wizard offers the ability to push all data for users who wish to explore ESPM's other available features.
When will the ESPM update with data from MEI?
MEI pushes data to ESPM once per week on Friday at 10:30 pm.
After I set up the ESPM account, how will I complete the requirements in ESPM for LBER?
Please follow these steps to share the data with DOER
After I set up the ESPM account and complete the requirements for LBER, is there anything else I need to do?
LBER also requires that building owners or managers complete two forms on the LBER Help Desk. First, a Claim My Building Form must be completed to link a point of contact to each building. Second, the Reporting Method Form is used to indicate to DOER that you wish to use your MEI data in ESPM to comply with LBER. When completing the Reporting Method Form, the Self-Managed Reporting method should be selected by answering the below questions as pictured:
Both the Claim My Building Form and the Reporting Method Form will ask you to provide the Unique Building Identifier (UBID) for each building. If you do not have the UBIDs, you can find these on the LBER Covered Buildings List or reach out to doer.ber@mass.gov for assistance.
The Reporting Method Form will also ask you to provide your ENERGY STAR Portfolio Manager username and the Portfolio Manager Property ID for each building. This is found near the top of the page when viewing each building in ESPM:
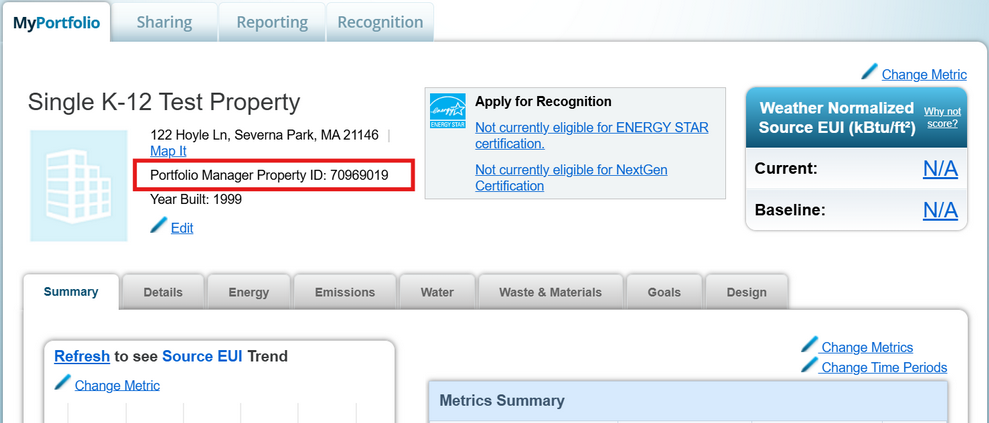
Additionally, there are other features in ESPM you could use to your advantage. When viewing a specific property, you will see a Summary tab that contains summary metrics. In order to populate these metrics, you will have to define Property Uses for the property. To do that, go to the Details tab, and on the right-hand side select a Type of Use, and hit “Add”.
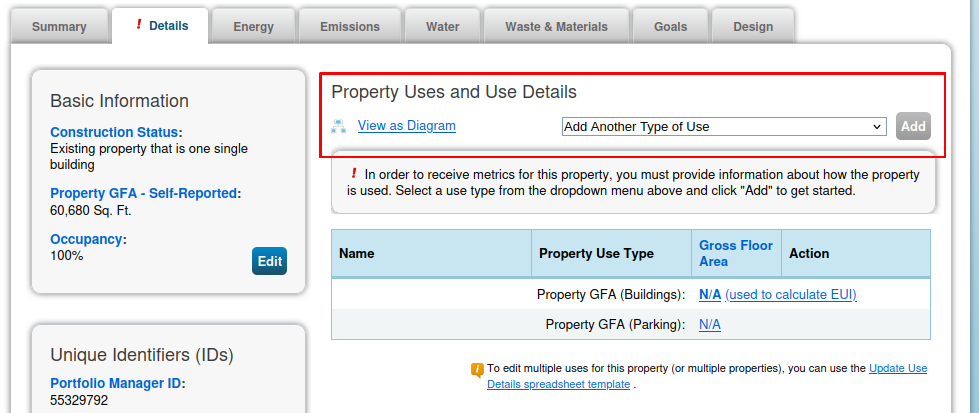
This will bring up a form that you need to complete. At a minimum you need to supply the Gross Floor Area for the use you selected. The sum of all Property Uses must equal the property’s Gross Floor Area. After you have completed adding the Property Uses, ESPM will be able to process the property’s metrics during their normal metric calculation timeline. Eventually you should be able to see something like this on your property’s Summary tab.
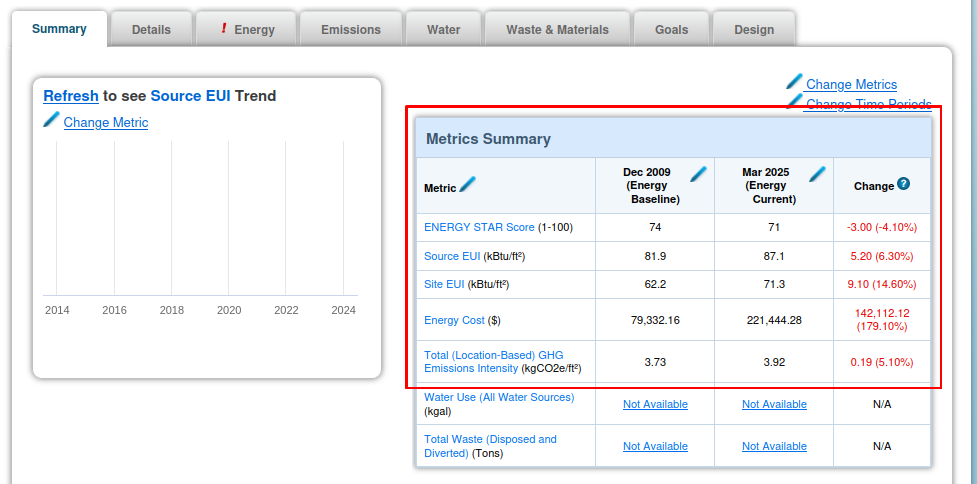
Troubleshooting
My username/password does not work
If your username/password combination does not work:
- Remember that the password is case sensitive.
- Try retyping your username and password again, as accurately as possible.
- If you have several log ins for different towns, make sure you are using the right
username/password combination.
- If your browser fills in the username and password for you, confirm that what it has
stored is cor
- If that does not work, contact Customer Support.
Why isn't my data appearing in the reports?
Here are a few common reasons why data may not appear in the reports.
- Changes to the organize data tree, or data newly loaded will not appear in the
reports until the following day.
- Items that don't have categories assigned won't appear in some reports.
- Accounts will not appear in the ESCO or Baseline reports if the accounts have been
"excluded" in these reports.
- Newly added accounts will not populate with data until the next load from the
utilities. Keep an eye on the home page to see when the next data load happens.
Why don't I see data for XXXX Year/Custom Views?
Double-check which years are selected in the filters on the right side of the reports.
The year of data that you would like to see may not be selected.
If the fiscal or calendar year has changed recently you may need to select the new fiscal
or calendar year. See the custom view question for updating views.
I have a "Sign in to Reports Server" Error (Embedded log-in/cookie
error)
Some users may see, after clicking on the name of workbook the Tableau server log in
"Sign in to Reports Server". This can happen if your browser is not allowing
cookies from our site, or when switching between user accounts if you have access to
data for more than one town, or when your browser tries to reload a report from the
previous day.
The first thing to try is to click on the log out link in the top right corner, and log
back in. Try opening the report again. If it succeeds, you're good. If not, you may need
to turn on third party cookies. You may be able to set your browser to accept third
party cookies just from our site. Please see your browsers preferences or help files for
more information on how to change this setting.
Of course if none of these steps fix the problem, please contact Customer Support.
Why can't I see or click on the tabs for Info, Item, or Accounts
Using Internet Explorer frequently causes this issue. We recommend that you try using a
different browser such as Edge (Microsoft's newer browser), Firefox, or Chrome.
"No Permission" error
A "No Permission" error usually means that you are trying to enter data using the upload
spreadsheet feature for an account that is no longer in your town, but is still in our
system. It's likely that an account was rejected from your city or town, and you are
still trying to load data for it.
- Crosscheck the list of accounts in the spreadsheet that you are uploading against
the accounts the list of accounts in MEI.
- Remove any data from the spreadsheet for accounts that you don't see listed in MEI;
or,
- Contact support to restore the account(s) that are not listed in MEI. Please include
the account number and the item under which the account belongs with your support
request.
Understanding your utility bill
Following is an example of a commercial utility bill, to help in finding your account
number and other information about your utility bill. For more information, you can
reach out to the specific utility.
Who is OptiMiser?
Who is OptiMiser, LLC and what is their role?
OptiMiser, LLC is a private company that
owns and operates the software platform behind MassEnergyInsight. OptiMiser also
contracts with UMass Clean Energy
Extension to provide user facilitation, support services, and training.
Energy
Conversion Factors
What factors are used for converting fuel usage into MMBTUs?
|
Electricity
|
MMBTU/kWh
|
0.003412
|
|
Natural Gas*
|
MMBTU/therm
|
0.1
|
|
Fuel oil -- heating (#2)
|
MMBTU/gallon
|
0.139
|
|
Fuel oil -- heating (#4)
|
MMBTU/gallon
|
0.145
|
|
Fuel oil -- residual fuel (#6)
|
MMBTU/gallon
|
0.14969
|
|
Propane
|
MMBTU/gallon
|
0.091
|
|
Diesel
|
MMBTU/gallon
|
0.139
|
|
Gasoline
|
MMBTU/gallon
|
0.124
|
|
Steam
|
MMBTU/gallon
|
1
|
|
Wood cords
|
MMBTU/cord
|
20
|
|
Wood pellets
|
MMBTU/lb
|
0.00775
|
* For natural gas data entered in CCF, the system first converts to
therms using a factor of 1.024.
What factors are used for calculating CO2 emissions?
MassEnergyInsight uses MassDEP's Massachusetts-specific electricity factors, which
change each year. These numbers are subject to change as methodologies and data sources
improve. To view the factors, log in to MEI, click View Reports in the menu bar and then
select Current Emissions Factors to access the current emissions factors report.
For all other clients, the system uses the ISO New England average system emission
rate for electricity. The electricity emissions factor changes from year to year,
depending on which sources were used to generate electricity and how much each
generated in a given year. The most recent calculated value is used for that year
and subsequent years, until the next factor is released. The factors for later years
are updated as more recent data becomes available. For electricity emissions factors
used for earlier years, please see the Emissions
Reports page at ISO New England's website.
|